What Sound Reduction Actually Describes
When sound strikes one side of a building element such as a door or a window, some of that energy is reflected back and some is absorbed within the element itself. What’s left is radiated into the space on the other side. Sound reduction quantifies that loss.
The important thing to understand is that this is a property of the product, not of the building it’s fitted into. It describes what the element does to sound passing through it, independent of the rooms either side and independent of the installation conditions.
Measuring it, though, is not straightforward. Sound power is derived from sound pressure levels taken on each side of the element, with corrections applied for room effects and for the area of the element. That derivation rests on two assumptions: that the sound field is sufficiently diffuse on both sides, and that the sound reaching the receiving room has travelled through the element under test rather than around it.
In a laboratory, both assumptions hold. In a building, neither entirely does.
Two Measurements, Two Sets of Conditions
R – sound reduction index
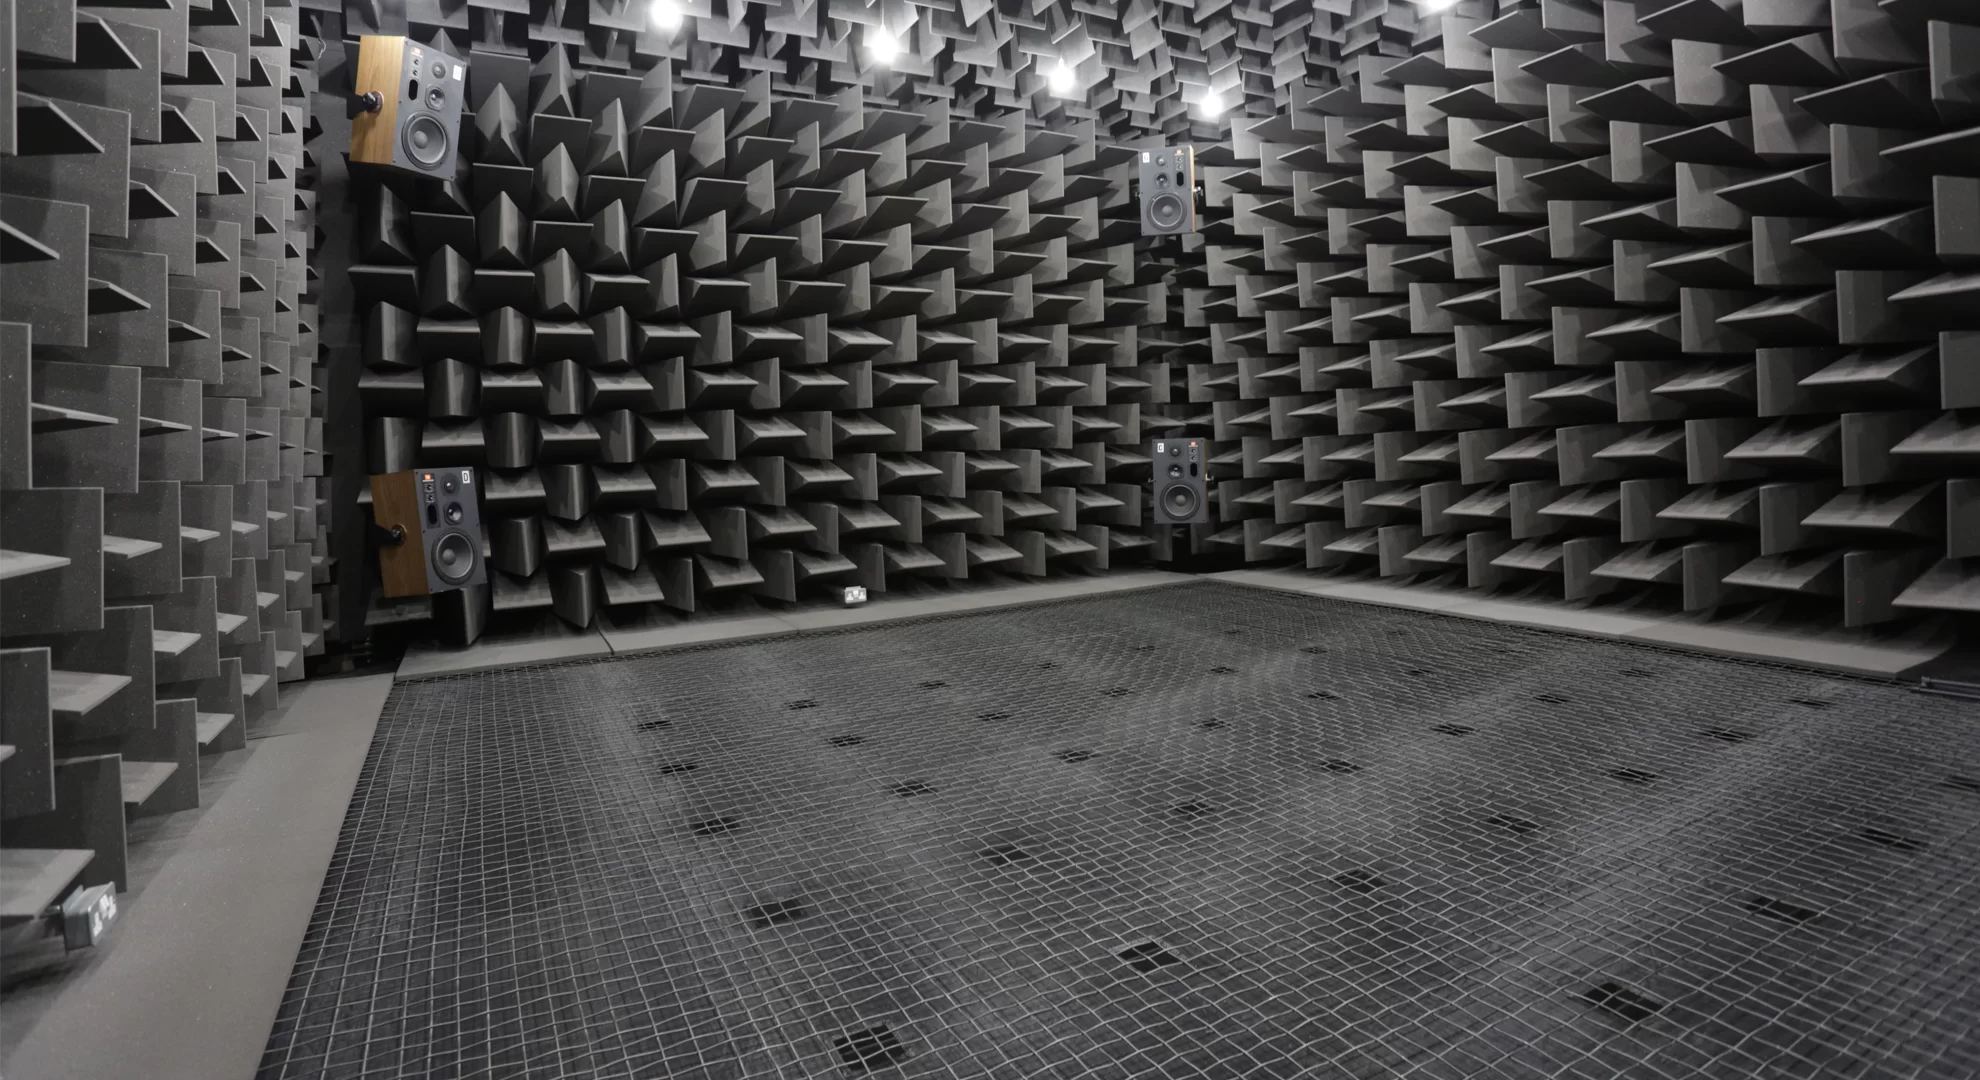
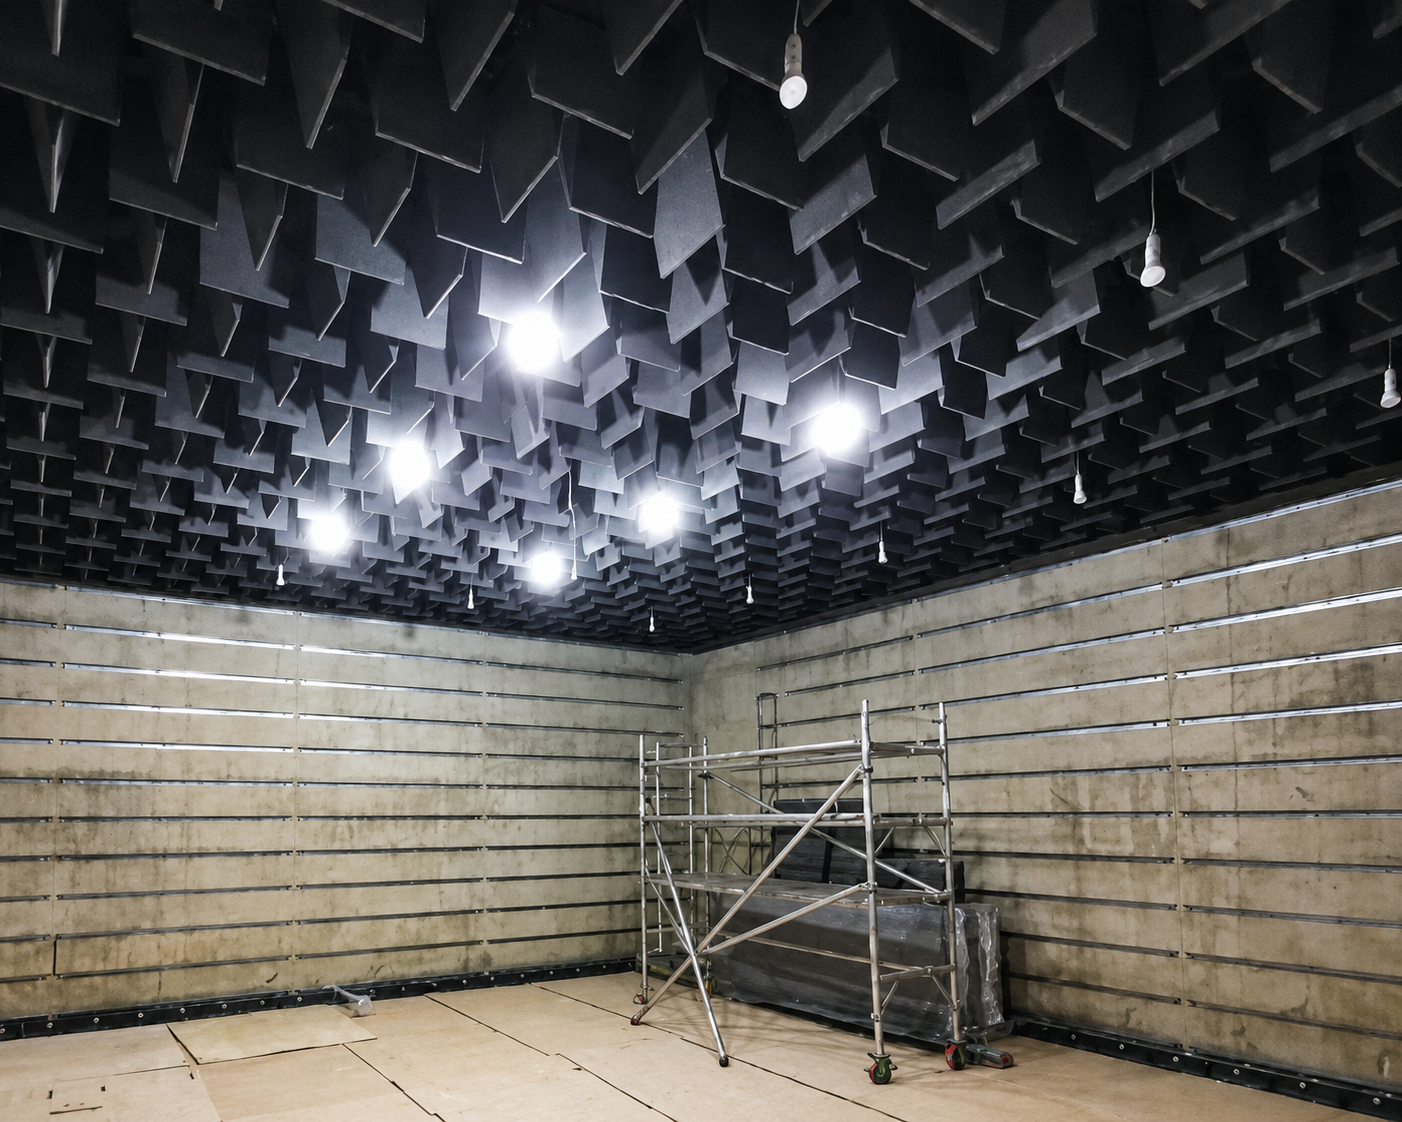
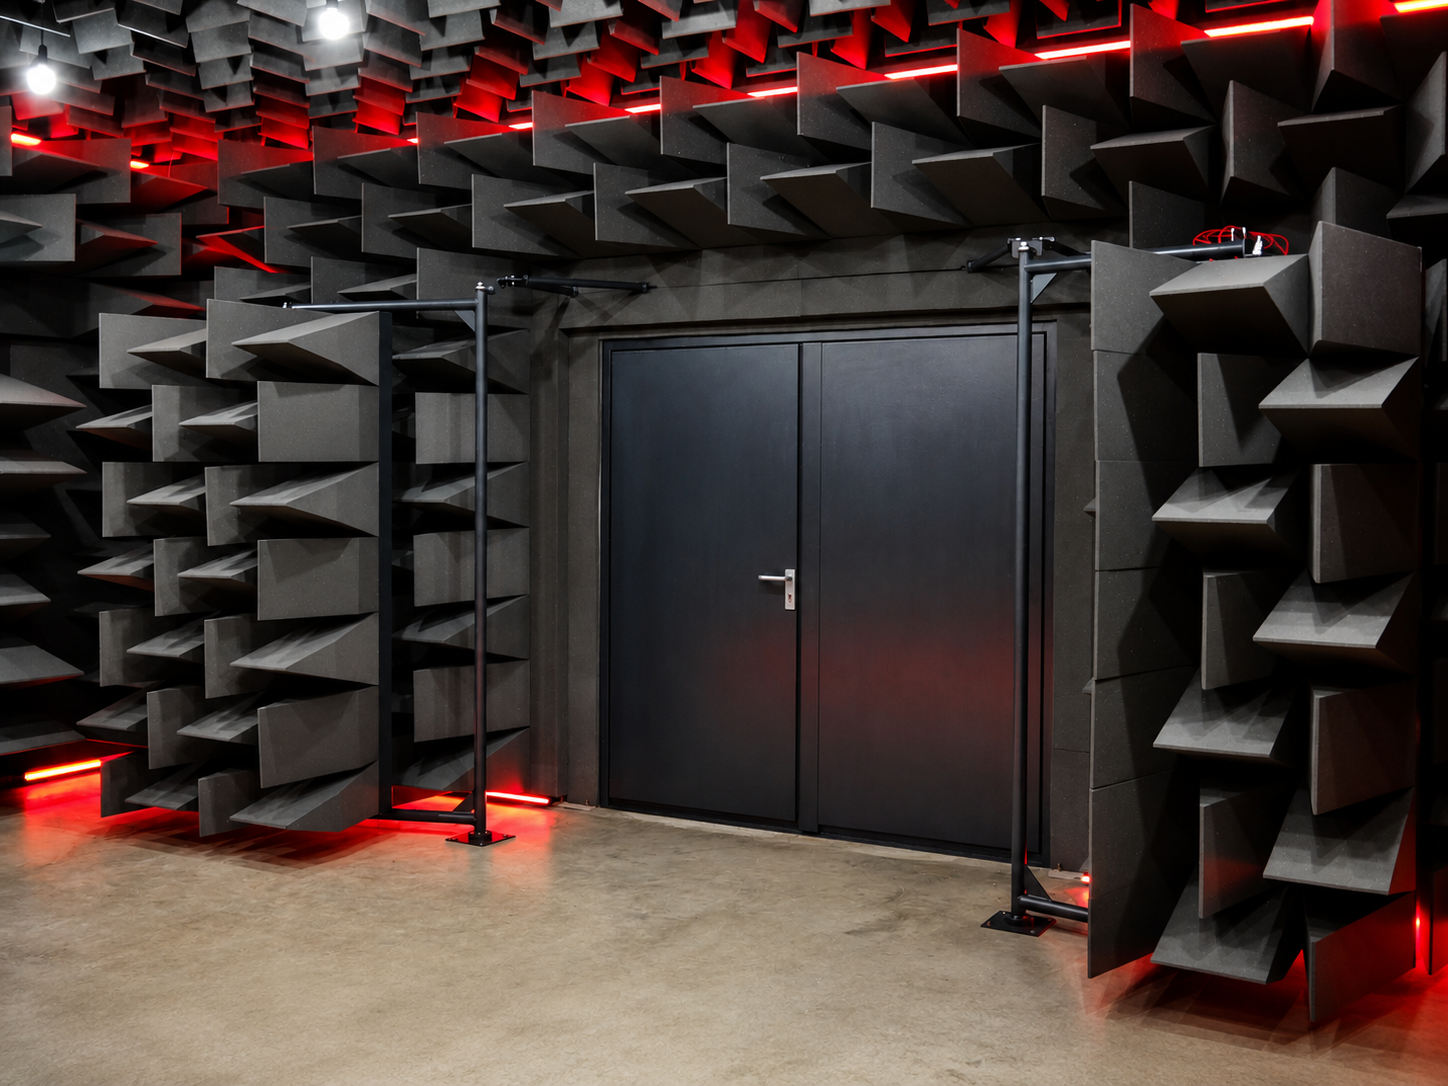
The laboratory measurement, taken to BS EN ISO 10140-2. The test element is installed between two purpose-designed rooms with near-ideal diffuse sound fields, and the facility is built so that sound transmitted via any route other than the test element is negligible.
R’ – apparent sound reduction index
The field measurement, taken on site to BS EN ISO 16283-1, in whatever conditions the building presents.
Both are frequency dependent, with a value at each one-third-octave band. To make specification practical, those values are converted into the single-figure ratings on datasheets ( Rw and R’w) using BS EN ISO 717-1.
Rw, R’w and DnT,w: Different Quantities Doing Different Jobs
Some of the confusion around installed performance comes from the number of different quantities in circulation. They aren’t interchangeable, and the single-figure ratings derived from them each have a formal name.
Rw, the weighted sound reduction index, is the laboratory figure for the product itself.
R’w, the weighted apparent sound reduction index, is the field equivalent of that same quantity. Because it’s corrected for the area of the element and the absorption in the receiving room, it’s directly comparable with the laboratory Rw. If the question is “how is this doorset performing against its lab rating?”, R’w is the figure.
DnT,w, the weighted standardised level difference, describes the sound insulation between two particular rooms, normalised to a reference reverberation time. It isn’t a property of the door. It takes in the receiving room’s volume and reverberation time, the dimensions of the separating construction and every flanking path around it. It has a closer relationship to what occupants actually perceive, but a weaker one to the product’s rated performance.
These three are the ones you’ll encounter most often on datasheets and in specifications, but they aren’t the only options. You may also see Dw, the weighted level difference, which is the raw difference in level between two spaces with no correction applied, and Dn,w, the weighted normalised level difference, which is corrected to a reference absorption area rather than a reference reverberation time. Which quantity is appropriate depends on what’s being assessed and why.
Where the Difference Comes From
Flanking transmission
This is the difference built into the definitions themselves. Laboratory facilities are designed so that flanking is negligible, which is a condition of a valid test rather than a claim that no flanking exists at all. In a real installation it is always present to some degree: sound also arrives in the receiving room via the surrounding wall, the floor, the ceiling and other elements. The apparent sound reduction index accounts for that additional radiated energy, which is why R will always be greater than R’ for the same product.
Product variation
A laboratory rating is usually established from a small sample of the product type, often a single unit. The unit tested on site is a different one. Some variation between two manufactured items is to be expected.
Differences in test method
The two standards use different procedures in different environments, and the corrections required to derive sound power differ accordingly. On site it isn’t always possible to achieve a sufficiently diffuse sound field, particularly in smaller or more heavily furnished rooms.
Measurement uncertainty
Every acoustic measurement carries uncertainty, addressed formally in BS EN ISO 12999-1. Even between accredited laboratories testing the same product there is some spread. Field measurements carry more, because deriving sound power in non-ideal rooms requires larger corrections. In both cases the magnitude is typically a couple of decibels, varying with frequency.
Why the Single Figure Magnifies the Gap
Each of those effects is fairly modest at one-third-octave band level. But the single-number rating isn’t an average of the band values. Under BS EN ISO 717-1 it’s derived by comparing the measured curve against a reference curve, with the final figure depending on where, and by how much, the measurement falls short of it.
That means the result depends on the shape of the measured spectrum, not just its overall level. Small differences spread across the frequency bands can compound when reduced to a single number. Four modest effects at band level can produce a noticeably larger difference between Rw and R’w.
What This Means for Specification
A difference of up to 5dB between Rw and R’w is normal. It is not a result of installation tolerances. It is the combined effect of flanking, product variation, test method differences and measurement uncertainty, amplified by the way single-number ratings are calculated.
The practical implications:
- Specify against the figure that matters. If a project requires a given performance in the finished room, express it as an installed R’w, not a laboratory Rw.
- The surrounding construction is part of the result. Because flanking contributes, the wall, floor, ceiling and junction details around an opening directly affect the measured figure.
- Treat the opening as an assembly. Frame, threshold, seals and surrounding build-up all contribute to what’s measured on site.
- Agree the quantity and the test method up front. Knowing whether compliance will be judged on R’w or DnT,w, and under which standard, avoids disagreements later.
The Practical Takeaway
Laboratory ratings are essential as they’re the only reliable way to compare products like for like, and they’re repeatable in a way site measurements can never be but they describe the product under controlled conditions. They were never intended as a prediction of what a specific installation will measure.
The number that matters in the finished building is the installed R’w, and the gap between it and the headline lab figure is a known, quantified and entirely normal part of acoustic measurement.
For more on how these ratings are derived, read our guide to understanding dB ratings on acoustic doors.
Speak to QuietStar about installed performance
We design, manufacture and install acoustic doorsets, glazed screens and rooms with the installed result in mind, not just the laboratory certificate.
View our door range at quietstar.co.uk/services/doors/, or speak to our doors and glazed screens specialist on 0333 444 0458.
Related Services
Learn more about QuietStar’s audiology room design services and how we can support your next project.
Need help with a refurbishment? Explore our audiology room upgrades and acoustic treatment solutions.